- How is LinkedIn engagement rate calculated?
- Interactions divided by impressions, times one hundred. Interactions are the visible ones: reactions, comments, and reposts. A post with 8,400 impressions and 458 interactions has a rate of 5.5%. This is the impressions-based formula, which is the one benchmarks and social teams use.
- Why is my rate here lower than the one LinkedIn shows?
- LinkedIn’s own analytics counts clicks as engagement: link clicks, "see more" expands, profile clicks. Those are invisible to everyone but you, and benchmarks cannot include what they cannot see, so the industry formula sticks to reactions, comments, and reposts. Both numbers are real; this one is the one you can compare against other people’s.
- What is a good engagement rate on LinkedIn?
- The 2026 platform average is around 5.2%, so a post above that is outperforming the platform’s average post. Format moves the number: carousels average about 6.6%, the platform’s best, with video around three times the engagement of text-only posts. But the benchmark that actually improves your writing is your own average, because your audience is the one you are trying to beat.
- Should I calculate by impressions or by followers?
- Impressions. Follower-based rates were the norm when feeds showed you your followers, but LinkedIn distributes well beyond them now, so dividing by followers flatters small accounts and punishes large ones. Impressions measure the post against the people who actually saw it.
- Where do I find these numbers for my post?
- Open the post and click the analytics view under it, available on any post you published. Impressions is the headline number; reactions, comments, and reposts are counted on the post itself.
- Why does my rate fall as impressions grow?
- Because the denominator grows faster than the interactions. A post that escapes your immediate network reaches colder audiences who engage less, so a falling rate on a rising reach is usually a sign of distribution, not decline. Judge small posts and viral posts separately.
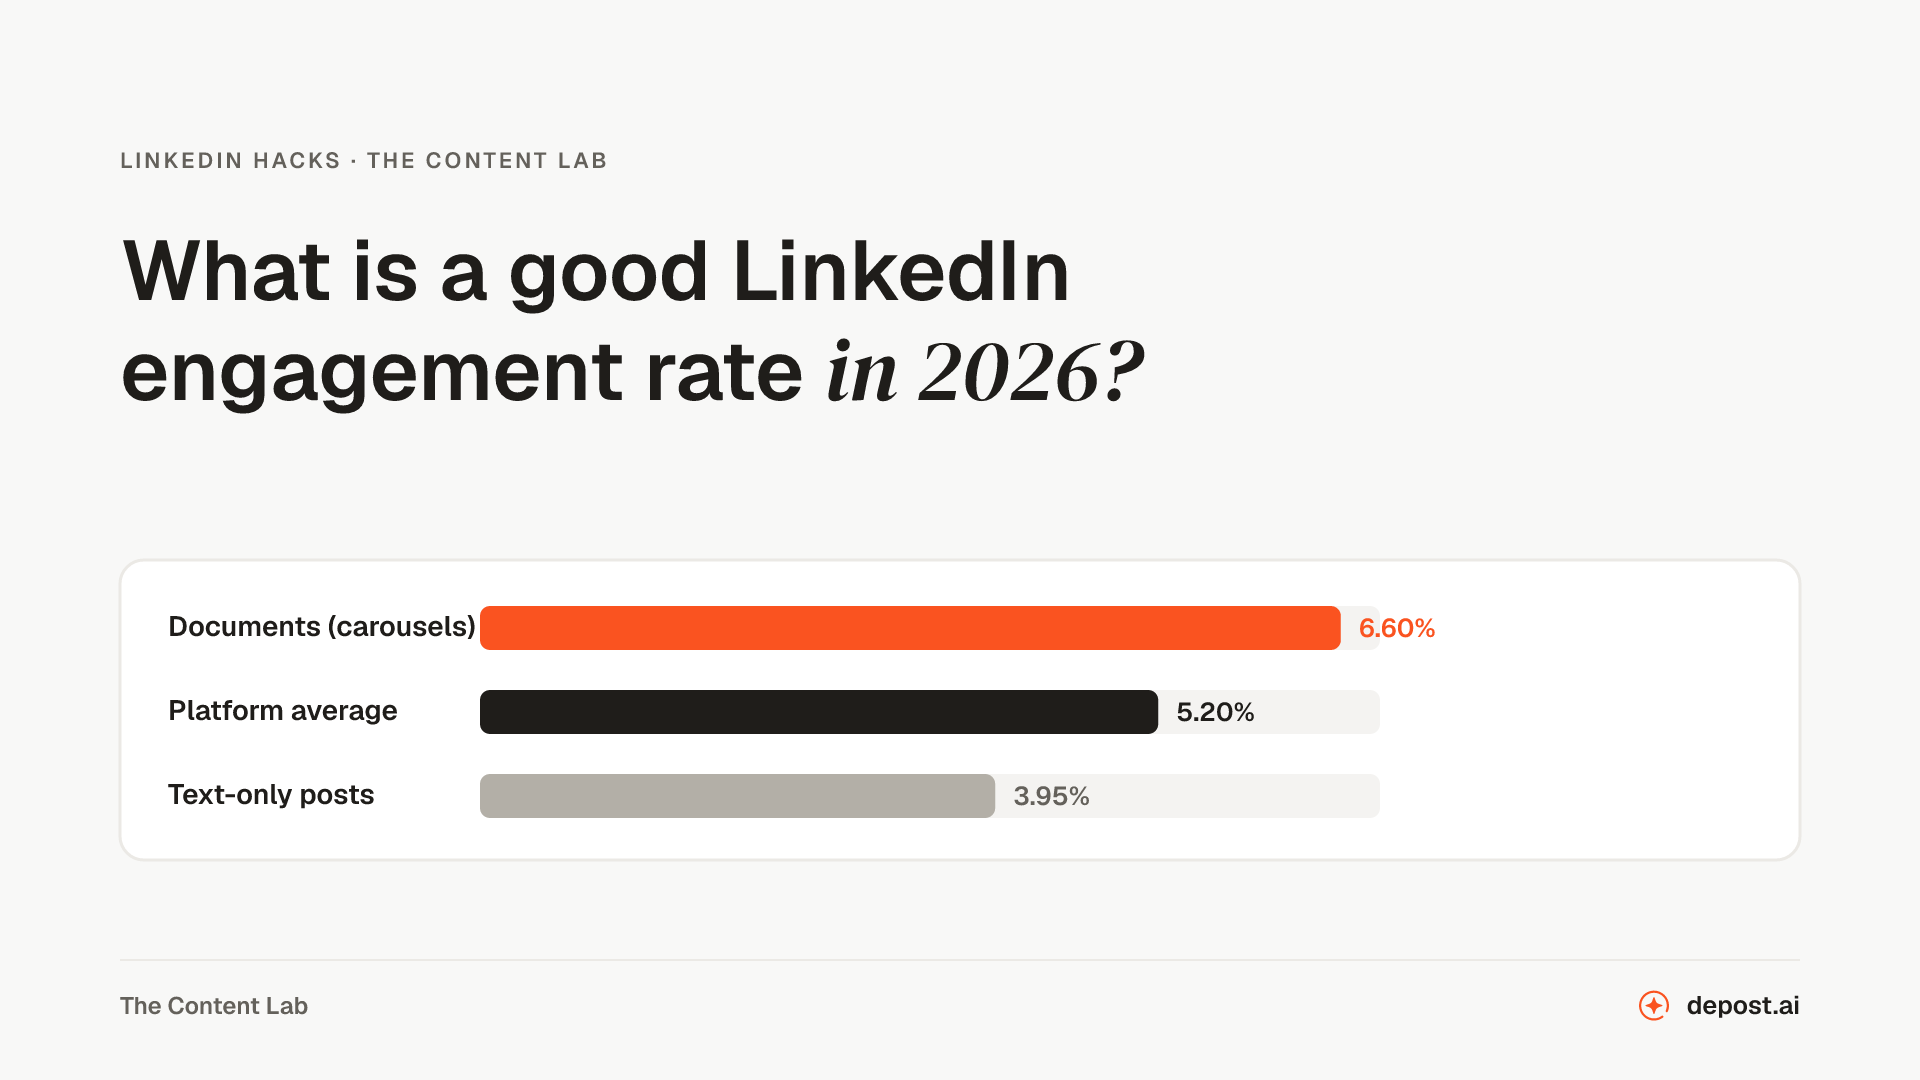 LinkedIn HacksWhat Is a Good LinkedIn Engagement Rate in 2026? Benchmarks by FormatThe 2026 benchmarks by format, the three formulas behind them, why two different rates for the same post can both be right, and what actually moves the number.
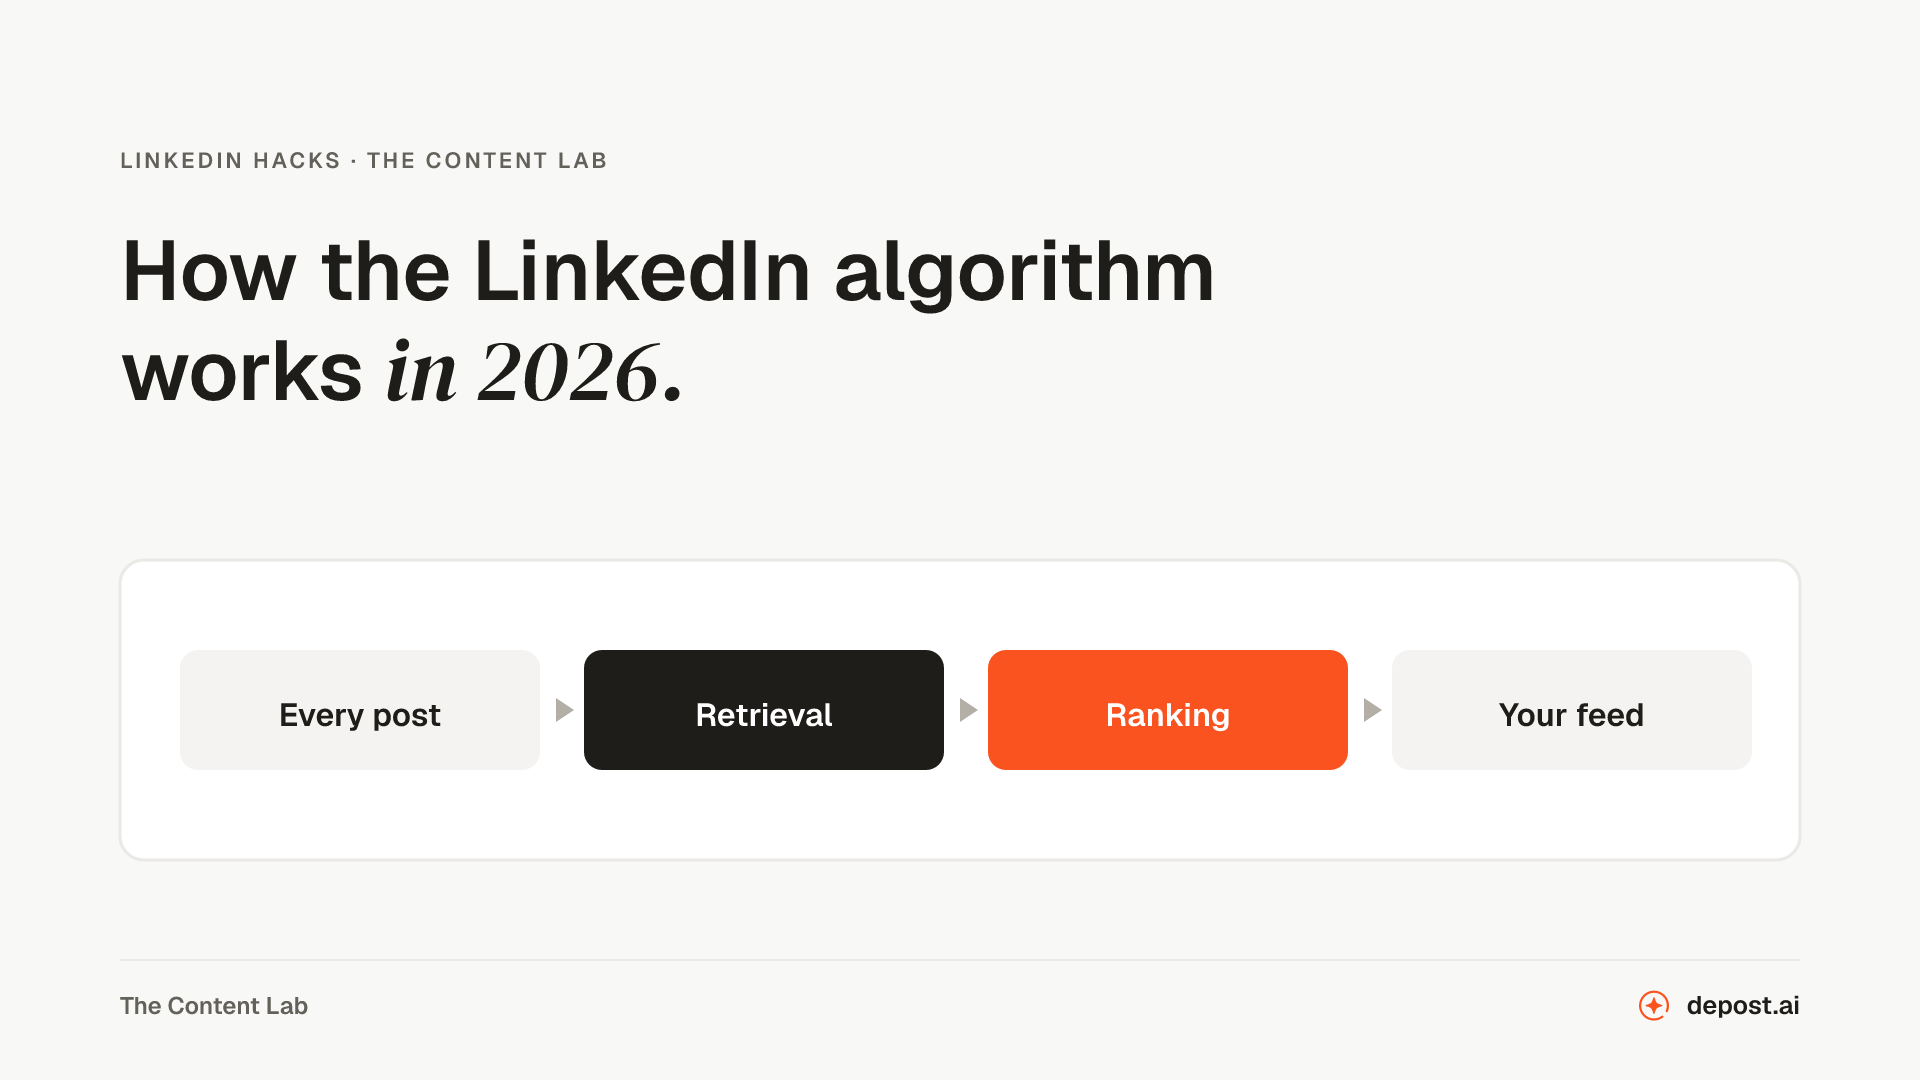 LinkedIn HacksHow the LinkedIn Algorithm Works in 2026LinkedIn rebuilt feed ranking in March 2026 and published how it works. Here is what the company confirmed, what third parties measured, and what is still guesswork.
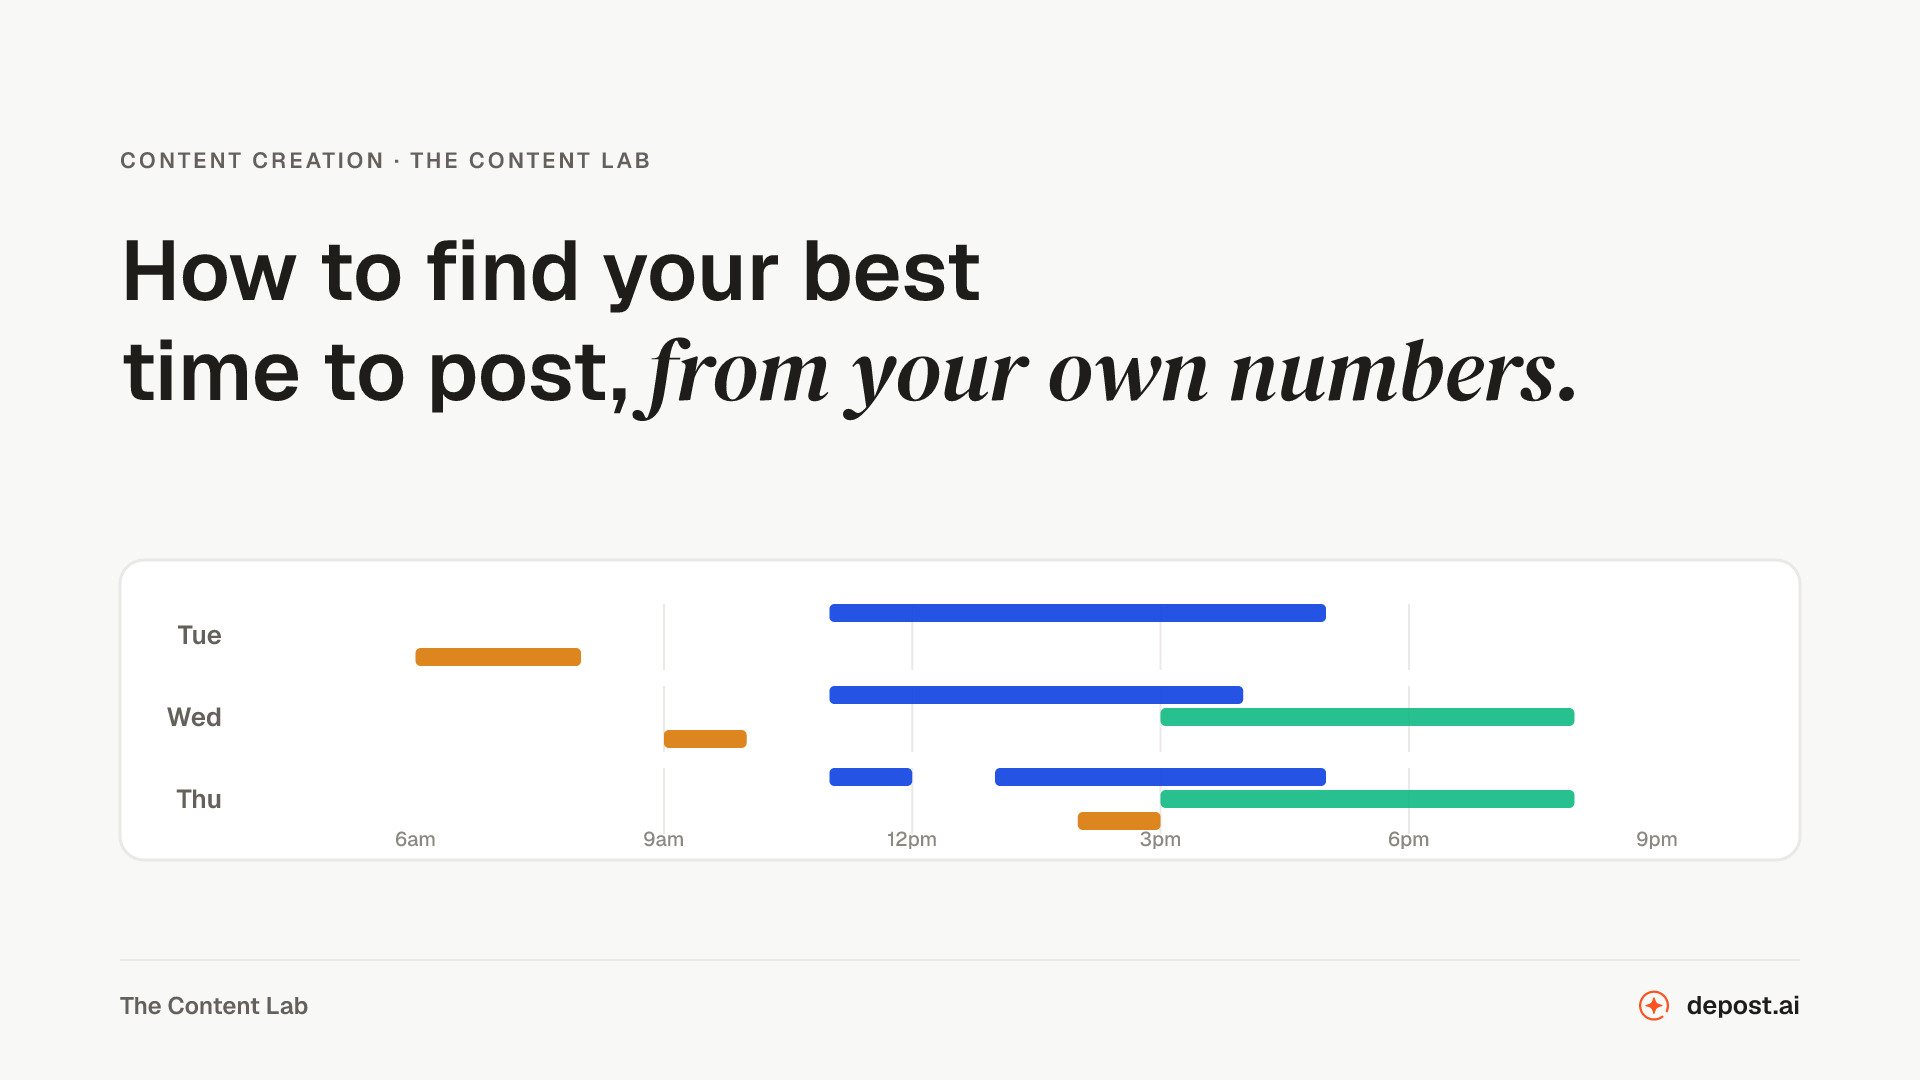 Content CreationBest Time to Post on LinkedIn: By Day, and How to Find YoursThe three current studies disagree by up to twelve hours, which tells you something. Here is what they say day by day, where they agree, and the four-week method for finding the window that fits your audience.